Overview
A Relationship Chart is a User Item that creates a chart that shows how two people are related. You specify the subjects of the chart and GedSite finds the lineage between them and shows each relative in that lineage.
If the two subjects you designate are not related, the Make Site process will fail.
If one person is an ancestor of the other, the chart will have a single column of boxes, with each row representing a generation between the ancestor and the descendant. If neither person is an ancestor of the other, then the chart will show lines of descent from their nearest common ancestor.
For people in the chart who have a person entry, the chart entry links to the person entry and vice-versa.
A Relationship chart is a Content Item and does not create a page of its own. You must add it to a Page User Item or you will not see its content.
Examples
Example 1

Example 2

Example 3

Example 4

Example 5

Edit Relationship Chart
The Edit Relationship Chart window controls the properties of a Relationship Chart.
Shared Properties
Chart colors are determined by the Theme but can be changed by the user via the properties in the Theme.Chart section. Other stylesheet options are controlled via the subsections under the the Styles.Charts section.
Chart Tab
Title
The Title property identifies the User Item in the User Items list.
Enabled
See Enabled in the Common Properties section of the User Items help page.
Subject 1
Specify the ID number of one of the subjects of the chart in the Subject 1 textbox.
Subject 2
Specify the ID number of one of the subjects of the chart in the Subject 2 textbox.
Picklist
You may use one of the Picklist buttons to select a subject. THe Picklist button changes the value of the subject textbox that is above it.
Include Spouses
If the Include Spouses property is checked, the Relationship Chart will include the ancestor spouses of the direct line ancestors.
Use Spouse Style
If Use Spouse Style is checked, spouse boxes will use the Chart Spouse Box style. If Use Spouse Style is unchecked, the spouse box will be styled based on gender.
Legend
Person Legend
The Person Legend property determines whether GedSite adds items that explain the entries in the chart that are colored by gender, and if so, where they will appear:
- None – not added to the legend
- Top – added to the top legend only
- Top, Bottom – added to both the top and bottom legend
- Bottom – added to the bottom legend only
Accent Legend
The Accent Legend property determines whether GedSite adds items that explain the entries in the chart that are colored by an Accent, and if so, where they will appear. The choices are the same as listed above.
Legend entries are mixed together. The subject item appears first, then Accents, if any, followed by the person items.

In the example, the "Direct Ancestors" item was created with an Accent.
Class
The Class textbox allows you to specify the name of a CSS class that will be added to the chart's container. To alter the appearance of every chart that shares the class name, define the class using a User Style.
Add References
If Add References is checked, GedSite will add a chart-type reference to each person who is included in the chart.
Add Spouse References
If Add Spouse References is checked, GedSite will add a chart-type reference to each spouse who is included in the chart. Add Spouse References is disabled if Add References is not checked.
Name and Date Tab
Name Format
The Name Format pull-down menu controls the format of names in the chart. The choices are "Full Name" and "Name w/ Middle Initials". The default is "Name w/ Middle Initials".
When Name Format is set to "Name w/ Middle Initials", GedSite transforms the given name field into a first name and middle initial.
Given names that include any of these characters are not changed:
" ' , ; : ( ) [ ]
For example, "John (Jack)" will appear as "John (Jack)", i.e., it is unchanged.
If a given name begins with one or more initials, the first non-initial middle name is retained. For example, "J. William Henry" will appear as "J. William".
If a given name includes more than one middle name, only the initial for the first middle name is retained. For example, "John Jacob Jingleheimer" will appear as "John J.".
When a chart includes a shortened version of the given name, the visitor may hover over the chart entry to see the person's full name.
Date Format
The Date Format pull-down menu controls the format of dates in the chart. It has the same choices as the date formats property described in the Dates section. The default is "Aaa yyy".
Lifespan Format
The Lifespan Format determines the format of lifespans in the chart. The default value is "(b. birth, d. death)".
The tooltip that is visible when a visitor hovers their mouse over a chart entry shows a lifespan will full dates.
Boxes Tab
The Boxes tab includes several properties for managing the layout of the chart.
The Width and Height properties control the size of the boxes.
The Row Leading, Connector Offset, and Connector Width properties control the spacing of the boxes in the chart.
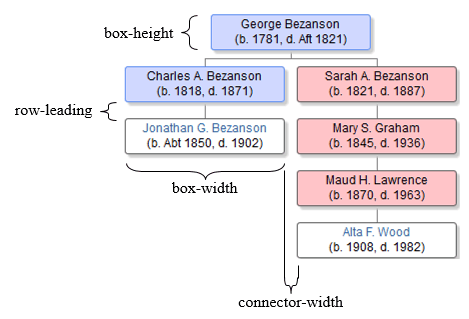
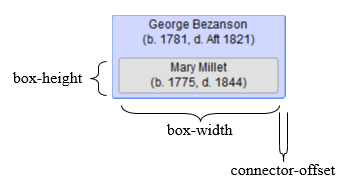
When the chart includes spouses, they are nested inside the box of their partner. The width of the partner box is expanded by the connector-offset to provide some spacing around the nested box.
Accents Tab
Use the Accents tab to add Accents to highlight selected members of the chart.